Singapore’s September export surge needs a closer look before machinery buyers use it as a demand signal. Non-oil domestic exports rose 68.4% from a year earlier, but Enterprise Singapore attributes much of the expansion to uneven shipments of ship and boat structures. The headline does not establish an equally strong increase across equipment markets.
The agency’s October 16 release reports September 2026 results, following 46.1% annual growth in August. These are already reported monthly outcomes, not forecasts or an October 18 trading update.
Product composition changes the interpretation
The full Enterprise Singapore report puts electronic non-oil domestic export growth at 107.6% and non-electronic growth at 54.2%, both year on year. Ship and boat structures contributed S$3.7 billion to the increase in the latter group. The agency omits that product’s percentage growth because an unusually low comparison base would make the rate exceptionally high.
Specialised machinery, another contributor, rose 50.4% and added S$1.0 billion. These are different product groups: a large ship-structure contribution cannot be read as evidence of the same movement in every machinery line.
Domestic exports and re-exports answer different questions
Singapore’s statistical glossary distinguishes goods of Singapore origin, including locally transformed goods, from re-exports sent abroad without transformation. Repacking or sorting does not count as transformation under that definition.
Enterprise Singapore reports specialised-machinery non-oil re-exports up 121.5% year on year in September. That is a separate trade channel from the 50.4% domestic-export increase. The two rates have different bases; neither should be substituted for the other in a supplier briefing.
Three checks for a purchasing discussion
- Match the product. Ask which statistical product group is relevant to the equipment or component being sourced. The national aggregate cannot identify an individual supplier’s orders.
- Match the measure. The release mainly reports nominal trade values. Higher export value alone does not establish how many machines were shipped or whether a buyer’s quoted price changed.
- Match the decision. Request current quotations, availability and confirmed delivery terms for the actual requirement. These statistics do not establish lead times or stock for a particular part.
This is a reason to narrow the evidence used in procurement, rather than extrapolate a national growth rate into a purchase forecast. Enterprise Singapore notes that its data can be updated or revised; retain the reporting month and release date beside any figures used in an internal comparison.
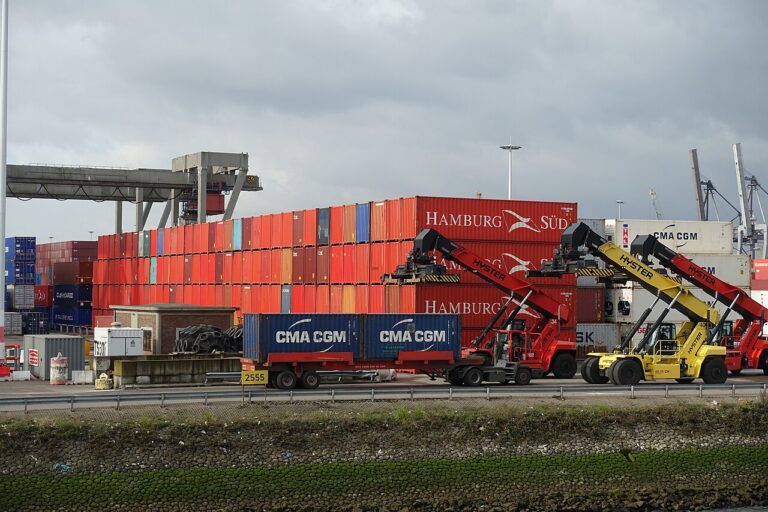
Photo context: the archive image shows Singapore’s Tanjong Pagar terminal in 2009. It does not depict the September 2026 shipments or establish the transport route of the reported goods.